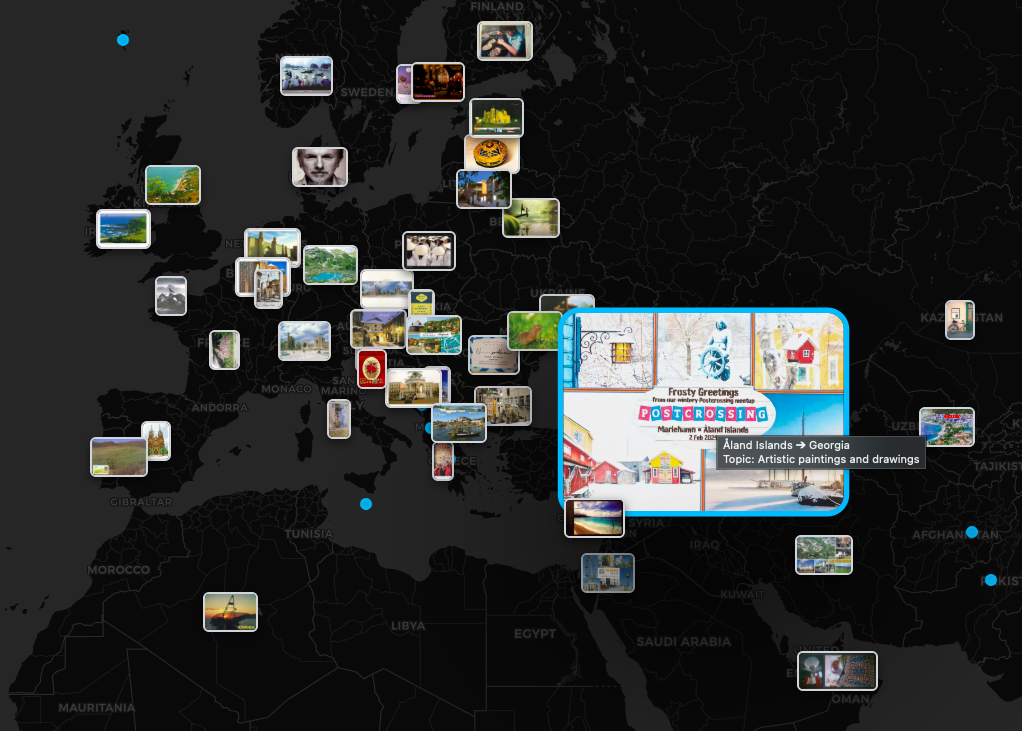
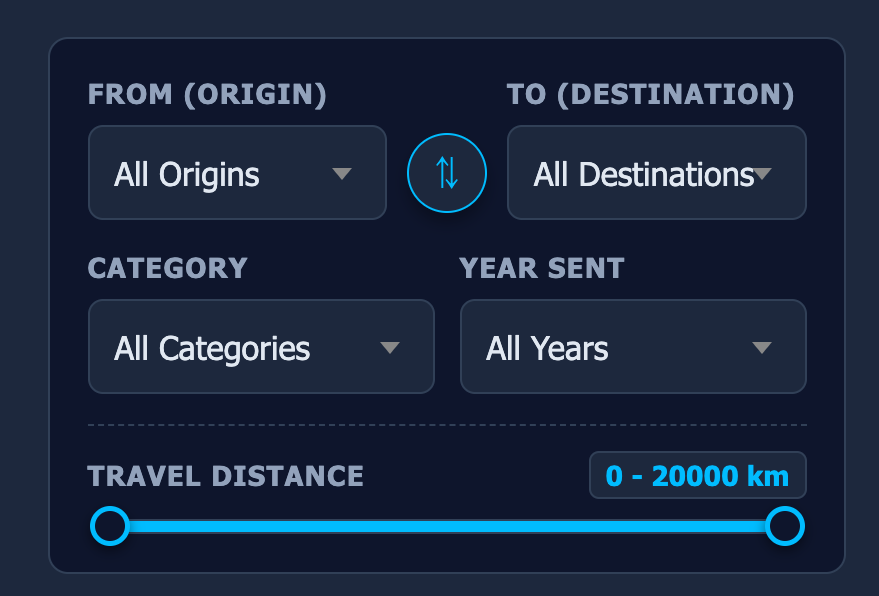
M1: List & Filters MANDATORY
Effective Data Exploration
- Dynamic List: Sidebar with scrollable postcard items showing key metadata.
- Global Filters: Multi-select for countries, years, and semantic topics.
- Range Filtering: Slider for travel distance and temporal selection.
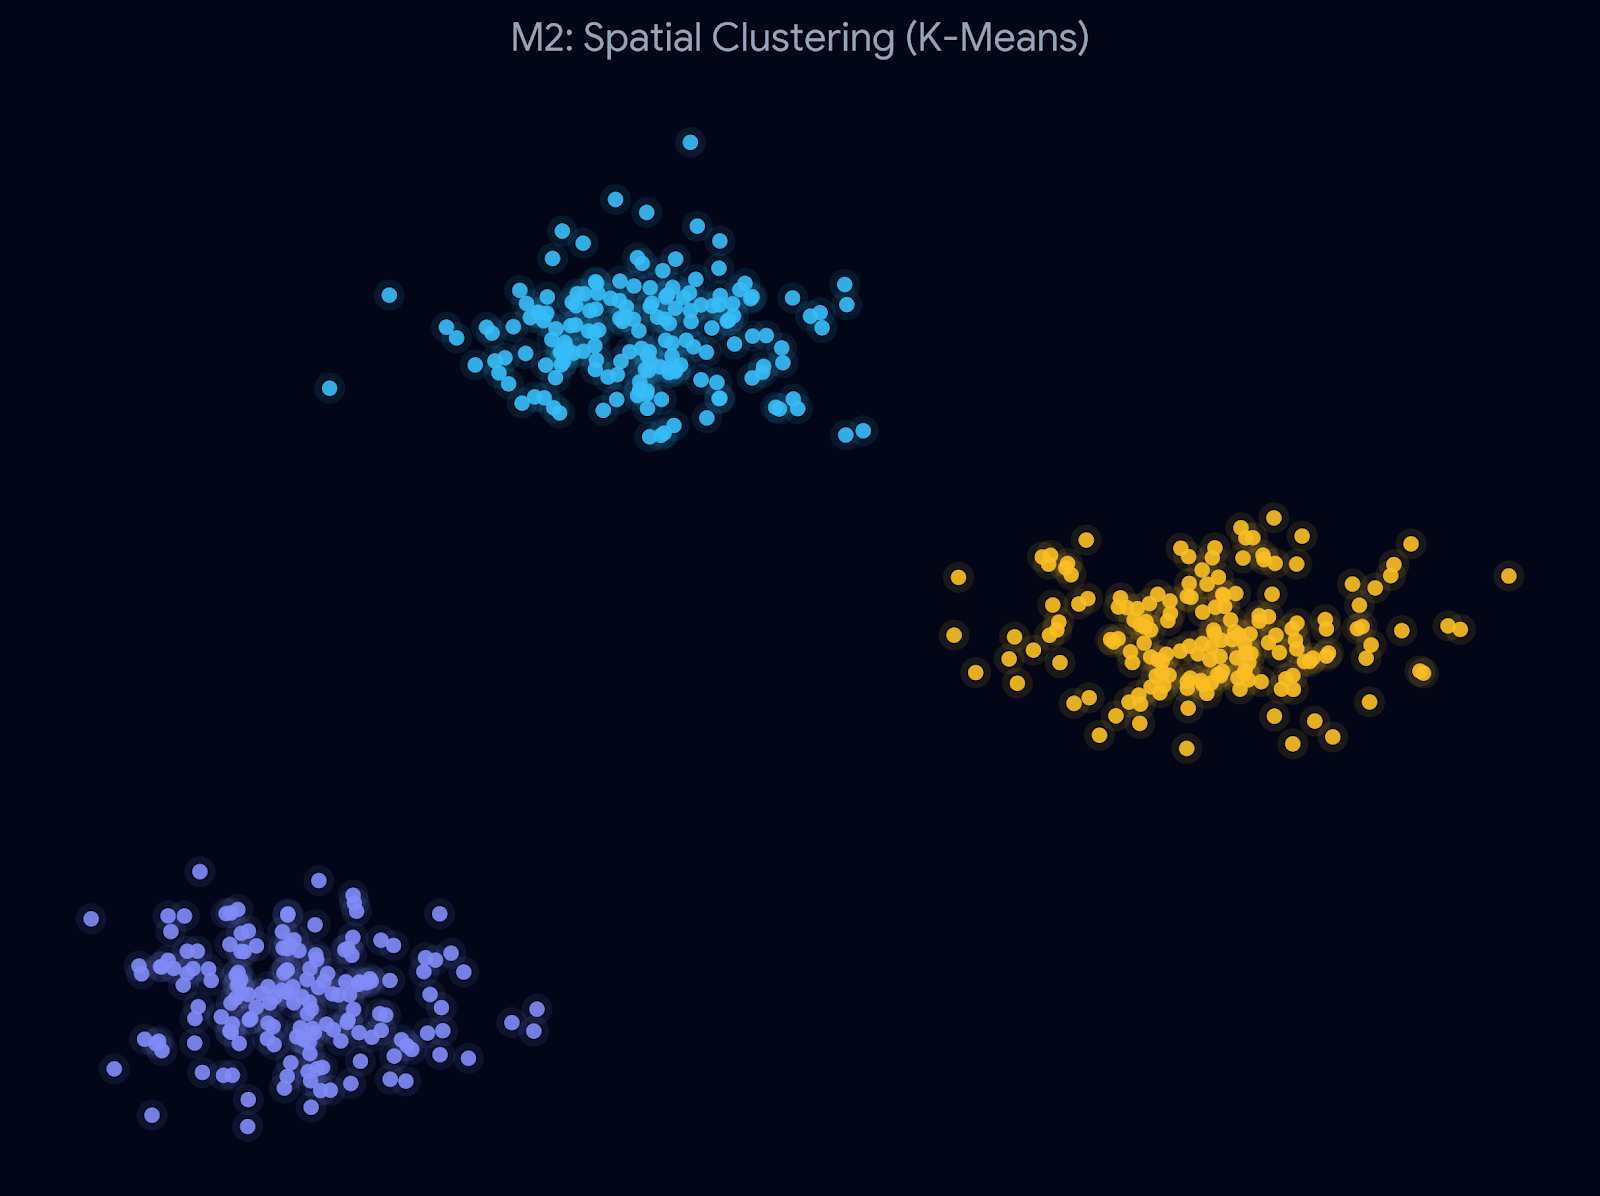
M2: Spatial Clustering MANDATORY
Unsupervised Feature Grouping
- Feature Extraction: Using CLIP model for high-dimensional image embeddings.
- Similarity Metric: Calculating Cosine Similarity between image vectors.
- Algorithm: Applying K-Means to group postcards into clusters.
M3: Linked Views MANDATORY
Dual-View Interaction
- Interactive Linking: Selecting a cluster in the spatial view highlights relevant paths on the map.
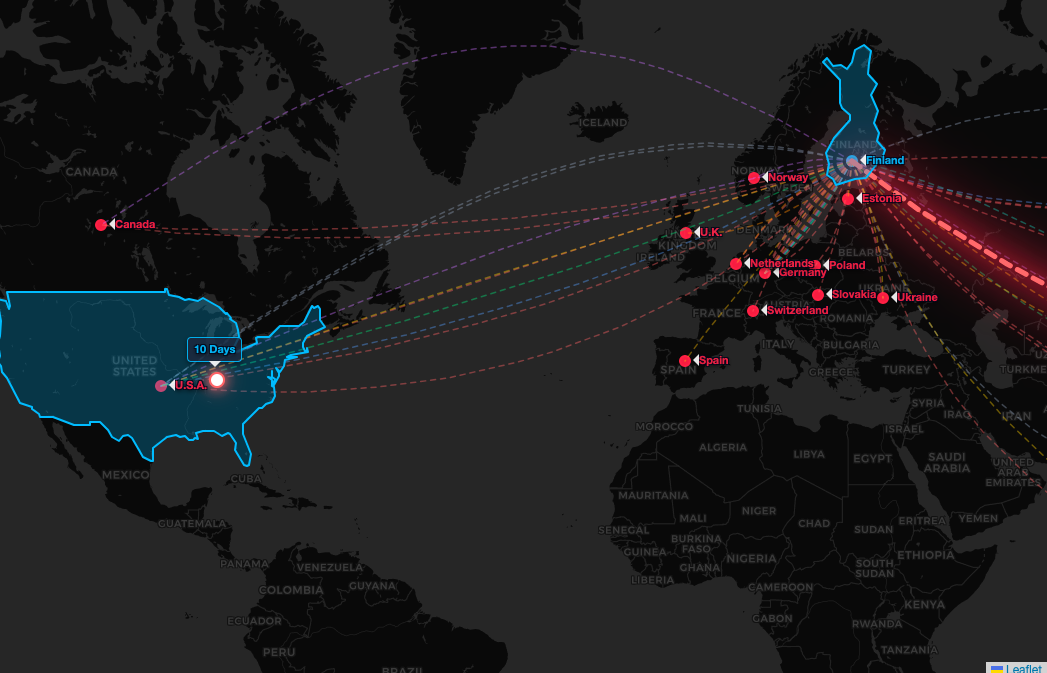
- Geo-Spatial Path: World map with Bezier curves representing postcard journeys.
- Visual Consistency: Color-coding clusters to match map paths.

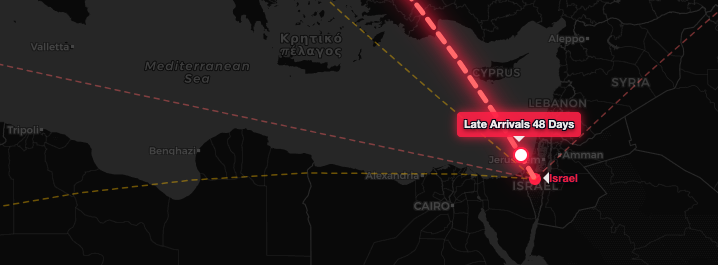
E2 & E5: Outliers & Animation ELECTIVE
Anomalies & Temporal Flow
- E2 (Outliers): Visually highlighting "Late Arrivals" (cards with outlier travel durations) on the map.
- E5 (Animation): Smooth animation of dots moving along the paths to show postcard flow over time.
E3: Semantic Zooming ELECTIVE
Detail on Demand
- Dynamic Zooming: Seamlessly transitioning from cluster dots to high-res postcard thumbnails.
- Performance Fix: Smart rendering logic to maintain 60fps while handling large image datasets.
Open Question: What are the best rendering strategies (e.g., Canvas vs. WebGL,
lazy loading) to prevent lag and maintain 60fps when semantically zooming into thousands of
high-res images?